Showing posts with label b) Feeding Relationships. Show all posts

Saturday, June 24, 2017

4.4: Explain the Names Given to Different Trophic Levels to Include Producers, Primary, Secondary and Tertiary Consumers and Decomposers

TROPHIC LEVELS: Feeding Level in a Food Chain

DEFINITION:

TERM
DEFINITION
PRODUCERS
Organisms that Produce their Own Organic Nutrients such as Plants through Photosynthesis
PRIMARY CONSUMERS
Herbivores and Feed on Plants (Producers)
SECONDARY CONSUMERS
Predators that Feed on Primary Consumers
TERTIARY CONSUMERS
Predators that Feed on Secondary Consumers
DECOMPOSERS
Bacteria and Fungi that Breaks Down Dead Animal’s Body, Urea and Undigested Waste for Energy (Using Enzymes to Break Down Compounds)

4.5: Understand the Concepts of Food Chains, Food Webs, Pyramids of Number, Pyramids of Biomass and Pyramids of Energy Transfer

FOOD CHAINS: Shows the Feeding Relationships Between Living Things (What Eats What in a Habitat)

FOOD CHAINS
Diagram Showing an Example of a Food Chain
EXPLANATION:

  • In the Diagram, the Flower will be the Producer as it is Produces their Own Organic Nutrients through Photosynthesis
  • The Flowers will be Eaten by Snails which are Primary Consumers as they will Eat Plants and are Herbivores
  • The Snails will be Eaten by Frogs which are Secondary Consumers as they are Predators
  • The Frogs will be Eaten by Foxes which are Tertiary Consumers as they are Predators at the Top of the Food Chain


FOOD WEBS: Shows All the Food Chains in an Ecosystem, Showing the Flow of Energy in a Habitat

FOOD WEBS
Diagram Showing an Example of a Food Web
EXPLANATION:

    Shows the Food Chains Joined Together:

  • Grass → Insect → Vole → Hawk

  • Grass → Insect → Frog → Fox

  • Grass → Insect → Vole → Fox

    Food Webs will Show Interdependence (Change in Population of One Organism
    will Affect the Population of Another Organism):

  • If Population of Insects Fall, Population of Vole may Decrease as they will Have Less Insects to Feed on so will Starve and Die

  • If Population of Rabbits Increase, Population of Fox may Increase as they will Have More Rabbits to Feed on so will Increase Chances of Survival


PYRAMIDS OF NUMBERS: Shows the Population of Each Organism at Each Trophic Level in a Food Chain

PYRAMIDS OF NUMBERS
Diagram Showing an Example of a Pyramid of Numbers
EXPLANATION:

  • The Bars represents the Population so Wider the Bar, the Larger the Population
  • The Producer will Always be at the Bottom
  • Energy is Lost to the Surroundings from One Trophic Level to the Next so there are usually Fewer Organisms at Each Trophic Level (Less Chances of Survival)
  • But Sometimes May Not Look like a Pyramid as One Large Producer can Feed Many Small Consumers (E.g One Oak Tree can Feed many Insects)


PYRAMIDS OF BIOMASS Shows the Transfer of Energy at Each Trophic Level by Calculating the Dry Mass of Each Population of Species

PYRAMIDS OF BIOMASS
Diagram Showing an Example of a Pyramid of Biomass
EXPLANATION:

  • Biomass is the Mass of Living Material in Each Organism Multiplied by their Population at Each Trophic Level
  • Pyramids of Biomass will Always Look like a Pyramid as Biomass is a Measure of the Amount of Food Available, this Decreases from One Trophic Level to the Next as Energy is Lost to Respiration, Not Digested or Not Eaten


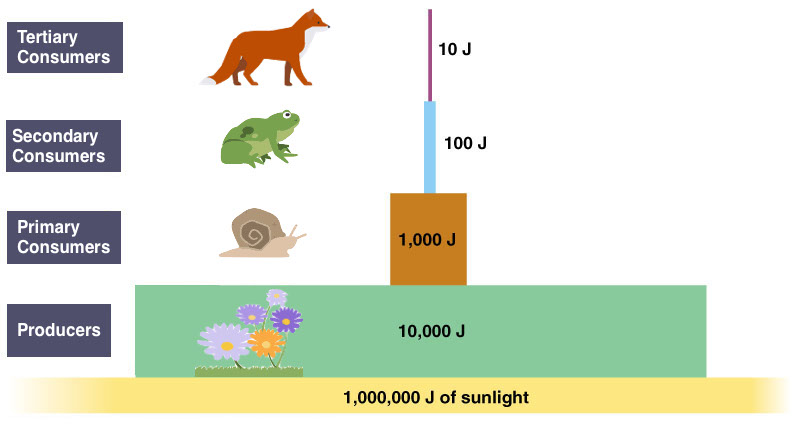
PYRAMIDS OF ENERGY TRANSFER: Shows the Transfer of Energy at Each Trophic Level from One Trophic Level to the Next

PYRAMIDS OF ENERGY TRANSFER
Diagram Showing an Example of a Pyramid of Energy Transfer
EXPLANATION:

  • Each Trophic Level Reduces the Amount of Energy Available for the Next  as Only 10% of Energy is Passed On
  • Energy is Lost to Respiration, May Not be Digested or May Not be Eaten, Causing the Availability of Energy to be Passed on to Decrease
  • This results to a Limit of Trophic Levels in a Food Chain

4.6: Understand the Transfer of Substances and of Energy Along a Food Chain

FOOD CHAINS: Shows the Feeding Relationships Between Living Things (What Eats What in a Habitat)

TRANSFER OF SUBSTANCES AND ENERGY:

TRANSFER OF SUBSTANCES AND ENERGY IN FOOD CHAIN
Diagram Showing the Transfer of Energy in Food Chain
EXPLANATION:

  • The Sun is the Ultimate Source of Energy as Plants will Absorb Sunlight through Photosynthesis to Produce Organic Food which is Consumed by Other Organisms, Passing Energy Down the Food Chain
  • Each Trophic Level Reduces the Amount of Energy Available for the Next as Only 10% of Energy is Passed On

ENERGY IS LOST TO:

  1. RESPIRATION
  • Respiration to Release Energy for Life Processes such as Movement or Heat Energy

    2.   NOT EATEN
  • Food May Not All be Eaten Such as Bones or Fibres

    3.   NOT DIGESTED
  • Food May Not be Digested, Resulting in Energy Lost to Faeces which are Broken Down by Decomposers

4.7: Explain Why Only 10% of Energy is Transferred from One Trophic Level to the Next

TROPHIC LEVELS: Feeding Levels in a Food Chain

ENERGY IS LOST TO:

REASON
EXPLANATION
RESPIRATION
Respiration to Release Energy for Life Processes such as Movement or Heat Energy
NOT EATEN
Food May Not All be Eaten Such as Bones or Fibres
NOT DIGESTED
Food May Not be Digested, Resulting in Energy Lost to Faeces which are Broken Down by Decomposers
EXCRETED AS WASTE
Food Eaten is Broken Down and Excreted as Waste, E.g, Urea